Description
Zenix™-C SEC phase, developed based on innovative surface coating technology, comprises of uniform, hydrophilic, and neutral nanometer thick film chemically bonded to high purity and mechanically stabilized silica. Zenix™-C, uses lay-down monolayer on porous silica as oppose to Zenix of stand-up monolayer (as shown below), offers ideal phase chemistry for hydrophobic samples like insulin, membrane protein monoclonal antibodies derivatized with polymer branches (polypeptide or PEG) separation. The 3µm based packing material allows for high resolution and performance separation.
Packing
Stationary Phase Structure Illustration and Comparison
Phase structure difference: a monolayer stands up on the silica surface for SRT® and Zenix™, and a monolayer lays down on the silica surface for SRT®-C and Zenix™-C.
Sepax SEC Product Family Comparison Chart
| Product Line |
SRT® |
Zenix™ |
SRT®-C |
Zenix™-C |
| Particle size |
5 µm |
3 µm |
5 µm |
3 µm |
| Pore size (Å) |
100, 150, 300, 500, 1000 & 2000 |
80, 100, 150, 300 |
100, 150, 300, 500, 1000 & 2000 |
80, 100, 150, 300 |
| Resolution |
High |
Highest, Short column for faster separation |
High |
Highest, Short column for faster separation |
| Efficiency |
High |
Doubled from 5µm |
High |
Doubled from 5µm |
| Selectivity |
Same for SRT® and Zenix™ |
Same for SRT®-C and Zenix™-C |
| Surface structure |
Chemically bonded stand-up monolayer |
Chemically bonded lay-down monolayer |
| Recommended Sample Types |
Monoclonal antibodies, proteins, peptides, nucleic acids, oligonucleotides, virus, and water-soluble polymers |
"Tough samples" such as hydrophobic proteins like insulin, membrane protein monoclonal antibodies derivatized with polymer branches, e.g. polypeptide, PEG. |
Zenix-C Technical Specifications
| Phase |
Zenix-C SEC-100 |
Zenix-C SEC-150 |
Zenix-C SEC-300 |
| Material |
Neutral, hydrophilic film bonded silica |
| Particle size |
3 µm |
| Pore size |
~ 100 Å |
~ 150 Å |
~ 300 Å |
| Protein MW range (native) |
100 - 100,000 |
500 - 150,000 |
5,000 - 1,250,000 |
| pH stability |
2 - 8.5 (pH 8.5-9.5 can be tolerated temporarily.) |
| Backpressure (for a 7.8×300 mm) |
~ 1,500 psi |
~ 1,375 psi |
~ 1,100 psi |
| Backpressure (for a 4.6×300 mm) |
~ 1,400 psi |
~ 1,250 psi |
~ 1,000 psi |
| Maximum backpressure |
~ 4,500 psi |
~ 4,500 psi |
~ 3,500 psi |
| Salt concentration range |
20 mM - 2.0 M |
| Maximum temperature |
~ 80 °C |
| Mobile phase compatibility |
Aqueous and organic |
Characteristic
- Ideal for separation and analysis of hydrophobic proteins, and monoclonal antibodies derivatized with polymer branches such as polypeptide or PEG
- Particle size of 3 µm
- Selection of pore size: 100, 150 and 300 Å
- Highest separation efficiency and resolution
- High capacity
- High lot-to-lot reproducibility
- High protein recovery with intact biological activity
- Negligible non-specific interactions
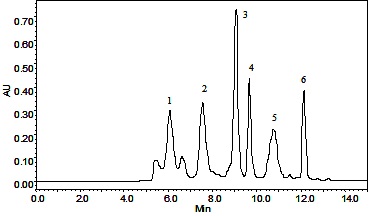
Separation of a protein mixture by Zenix-C SEC-300 column.
 |
| Conditions |
|
| Columns: |
Zenix-C SEC-300(3 µm, 7.8×300mm) |
| Mobile phase: |
150 mM Sodium Phosphate, pH 7.0 |
| Flow rate: |
1.0 mL/min |
| Temperature: |
Ambient (~23 °C) |
| Detection: |
UV 214 nm |
| Injection volume: |
10 µL |
| Samples: |
1) Thyroglobulin, 670kD
2) γ-Globulin, 158 kD
3) Ovalbumin, 44kD
4) Myoglobin, 17.6 kD
5) Poly-DL-alanine (1-5 kD)
6) B12, 1.35 kD |
|
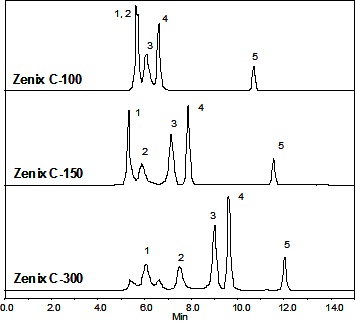
Separation of Biorad protein mixture by Zenix-C SEC 100, 150 and 300 columns.
| Conditions |
|
| Columns: |
Zenix-C (3 µm, 7.8×300mm) |
| Mobile phase: |
150 mM Sodium Phosphate, pH 7.0 |
| Flow rate: |
1.0 mL/min |
| Detection: |
UV 214 nm |
| Injection volume: |
10 µL |
| Samples: |
1) Thyroglobulin, 670kD
2) γ-Globulin, 158 kD
3) Ovalbumin, 44kD
4) Myoglobin, 17.6 kD
5) B12, 1.35 kD |
|
 |
Separation of protein mixture A by Zenix-C SEC 100, 150 and 300 columns.
 |
| Conditions |
|
| Columns: |
Zenix-C (3 µm, 7.8×300mm) |
| Mobile phase: |
150 mM Sodium Phosphate, pH 7.0 |
| Temperature: |
Ambient (~23 °C) |
| Flow rate: |
1.0 mL/min |
| Detection: |
UV 214 nm |
| Injection volume: |
10 µL |
| Samples: |
1) Thyroglobulin, 670kD
2) BSA, 66kD
3) Ribonuclease A, 13.7kD
4) Uracil , 120D
|
|
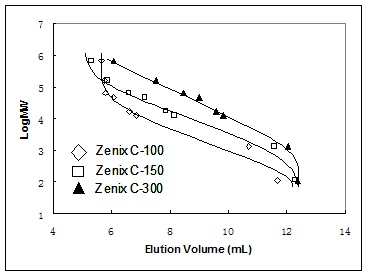
Protein molecular weight vs elution volume is plotted in below figure, indicating Zenix-C 100, 150 and 300 have large linear elution region.
Protein MW calibration with elution volume for Zenix-C phases.
| Conditions |
|
| Columns: |
3 µm, 7.8×300mm |
| Mobile phase: |
150 mM Sodium Phosphate, pH 7.0 |
| Flow rate: |
1.0 mL/min |
| Detection: |
UV 214 nm |
| Injection volume: |
10 µL |
| Samples: |
1. Thyroglobulin, 670 kD
2. γ-Globulin, 158 kD
3. BSA, 66 kD
4. Ovalbumin, 44 kD
5. Myoglobin, 17.6 kD
6. Ribonuclease A, 13.7 kD
7. B12, 1.35 kD
8. Uracil, 120 |
|
 |
bio-equip.cn Profile
Sepax Technologies, Inc., a privately held company, was founded in Delaware, USA in November 2002. It develops and manufactures HPLC consumables, bulk media, and equipment in liquid chromatography for chemical and biological separations. It is a fast growing technology company and owns patents, proprietary technologies and know-how. Sepax has emerged as a leader in the biological separation industry in the global market.
Business strategies
Sepax Technologies, Inc. develops innovative HPLC consumables, bulk media, and instruments to solve separation challenges in the global market. We provide solution-based products by closely working with our customer scientists in pharmaceuticals, biopharmaceuticals, research institutes and government labs. Our strong technical team develops various methods with our customers to analyze complex biological molecules. As a leader in the biological separation industry, we constantly develop the best bio-separation technologies and products for our global customers. We have reached a competitive position globally in fast growing regions.
Vision Statement
To become a technology leader in the biological separation industry in the global market and provide solution based products and services for our customers.
Operation
Sepax Technologies, Inc.
Our company headquarter in Delaware is located in Delaware Technology Park with facilities of 15,000 ft2 dedicated to the development of separation resin technologies and instrumentation, production of HPLC resins, columns and CE consumables. It is also the marketing and sales center for our US and global markets.
Sales
Domestic
Audrey Fisher
Field Sales Account Manager
(Northern CA areas, UT, CO, OR)
Direct Phone: 925-324-5223
Email: afisher@sepax-tech.com
Kathleen Falls
West Coast Regional Manager
(All other CA areas, WA, TX, AZ, NM, MI)
Direct Phone: 323-228-0004
Email: kfalls@sepax-tech.com
Michael Hunnewell
Field Sales Account Manager
(MA, RI, NH, CT, NY)
Direct Phone: 302-650-3955
Email: mhunnewell@sepax-tech.com
Colleen Callahan
Midwest Account Manager
(WI, IL, IN, OH, MO)
Direct Phone: 302-366-1101, ext 106
Cell Phone: 302-339-8747
Email: ccallahan@sepax-tech.com
All other areas, please contact
Helen Gu
Vice President, Sales
Direct phone: 302-650-3909
Email: hgu@sepax-tech.com
International
Tingting Wu
Executive Account Manager/Marketing
Phone: 302-366-1101, ext 115
Email: twu@sepax-tech.com
|

